This article was originally published on Dental Group Practice on November 2, 2021.
Jarvis Analytics helps define common goals and drive opportunities for bottom line growth
“If you can’t measure it, you can’t improve it.” – Peter Drucker
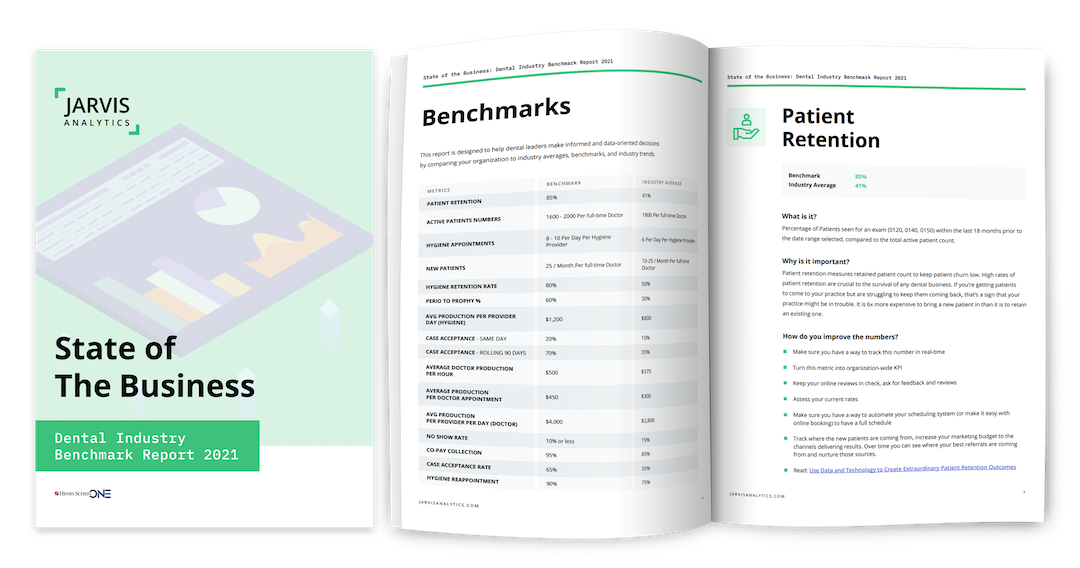
Dental leaders need to know what the healthy business metrics, KPIs and benchmarks should be for their organization, and they should be monitoring these success metrics on a regular basis, if not in real time. However, most dental organizations only use 1% of the data available to them for making important business decisions.
The good news is with the help of industry benchmarks, dental executives can quantify the organization’s progress, create operational efficiencies, unlock hidden opportunities, and make changes necessary to achieve desired results.¹
So how does that happen?
It helps to have an accountability tool that empowers your team who is responsible for scheduling production, collecting fees, and creating clinical standards.
“Many dental organizations think that reports and data produced by their practice management system (PMS) is enough,” said Melissa Marquez, COO of Jarvis Analytics and a former DSO executive.
“However, many organizations we talked to run their business with outdated spreadsheets filled with stale data and gutfeel,” she said. “They use tools that aren’t built for data analytics or for making important business decisions, but rely solely on reports providing transactional data and not actionable insights.”
Jarvis Analytics, a Henry Schein One company, taps into data, providing real time analytics to their dental organization clients that supports their goals for growth. The platform that sits on top of the PMS as an intelligence layer can discover actionable insights to fuel growth for dental organizations. It primarily works with DSOs and dental groups that need access to their information without having to spend time gathering it manually from their PMS.
“In the dental industry, we measure everything. A lot of things are measured when a patient’s health is being examined, for example. Measurement is inherent. And the health of a dental practice can be measured through an accountability tool like Jarvis Analytics. We normalize the PMS data into the practice’s own definitions and visualize the data so it is apparent what the opportunities are to drive performance,” Marquez said.
Different PMS models diverge in how they measure data. Marquez says they might adjust at different times. For example, one PMS model might recognize a new patient when the first appointment is created, and another model might recognize that benchmark when the first procedure is completed. A new patient might also be recognized differently between the front office and the marketing team of a dental organization.
“Those common definitions and goals must be aligned and until they are, everyone is rowing in different directions,” Marquez said.
Jarvis Analytics communicates with PMS models in real time or through flat file uploads to update data every day, and for most of its clients, every hour. “We can layer unique definitions on top of that and even if different PMS models within a DSO or group define things differently, they can set unified definitions within Jarvis Analytics. It’s seamless once we’ve plugged into the PMS.”
But which benchmarks are the most important to measure?
Patient retention tops the list for Marquez. “You can have the best marketing strategy ever, but if you’re losing more patients than you’re gaining, you’re in a losing battle,” she said. “You’re never going to add providers or grow your practice to a very profitable level. But patient retention is a lag measure because many things play into it.”
So, it’s important to look at other benchmarks like production per day. According to Marquez, most dental offices and DSOs look at this benchmark per month but she thinks it’s important to look at each provider per day.
“It leads to greater profitability levels,” she emphasized. “Hygiene should be the most profitable line of business in a dental practice. But if there’s a high no-show rate and hygienists are seeing four patients per day while staying clocked in for eight hours, then the practice isn’t as profitable as it could be.”
Measuring production per day is a fast way to see opportunity for growth in a practice’s bottom line. It also helps compare each location in a DSO. “Our module helps DSOs understand why one location is doing 10% perio to prophy, for example, while 10 other locations are performing at 50%,” Marquez said.
Jarvis Analytics uses the power of comparison as a way to improve clinical care. Awareness between DSO locations is key because different providers can have different continuing education courses or access to equipment.
“It helps to level the playing field,” Marquez said. “The data doesn’t lie.”


